

Identifying Supply and Demand Zones and Automating Their Trading
Spotting supply and demand zones on your charts can be a helpful trading tool. Similar to support and resistance levels, these zones highlight areas on the chart where the price is likely to bounce or reverse.
Traders use these zones to pinpoint areas where they might buy or sell. In other words,supply and demand zones act as a first filter, helping you identify potentially profitable price levels.
SUPPORT AND RESISTANCE VS SUPPLY AND DEMAND
Although the concept of supply and demand is somewhat similar to support and resistance, there are some important differences between the two concepts. Whereas support and resistance levels simply exist at price turning points, supply and demand zones are found at the origin of strong momentum and trend movements.

The image below shows conventional support and resistance zones, marking price turning points. Many traders struggle using support and resistance because the price often reacts quickly at those levels without providing easy entry points.
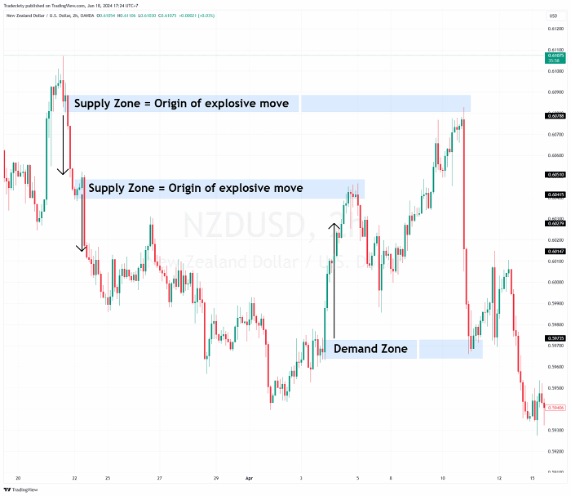
Supply and Demand zones, on the other hand, are drawn around the consolidation before a strong and explosive price move. Later, when the price returns to such zones, the price will often show a similar reaction. We can see in the screenshot below that when the price created the two supply zones in the downtrend, the price later touched the zones, moving lower once again.
What are supply and demand zones?
A supply zone is where the supply of a cryptocurrency exceeds the demand; there is excess supply; the price is falling; and a price chart will show a downtrend. On the other hand, a demand zone is where the demand for a cryptocurrency exceeds the supply; demand is high; the price is rising; and a price chart will show an uptrend.
In crypto trading, crypto whales or institutional investors often lead to high levels of activity. These zones are resistance levels that confirm a trend. They are not quite as simple to spot as a quick dip or rise in price, but there are patterns to look for. The following sections explain in depth how supply and demand zones can be more accurately identified.
THE 6 TIPS FOR SUPPLY AND DEMAND TRADING
Whereas drawing support and resistance levels is straightforward, finding good supply and demand zones is often not as simple. For that reason, this article explains the 6 odds enhancers that enable traders to distinguish between good and bad supply and demand zones in their trading.
1) MODERATE VOLATILITY
A good demand zone typically shows narrow price behavior before the explosive breakout. If the zone shows a lot of candle wicks and strong back and forth during the zone, it doesn't qualify as a high-probability zone.
2) TIMELY EXIT
A good supply zone is characterized by a short consolidation. Good supply zones are somewhat narrow and do not hold too long. A shorter consolidation zone works better for finding re-entries during pullbacks that are aimed at picking up open interest.
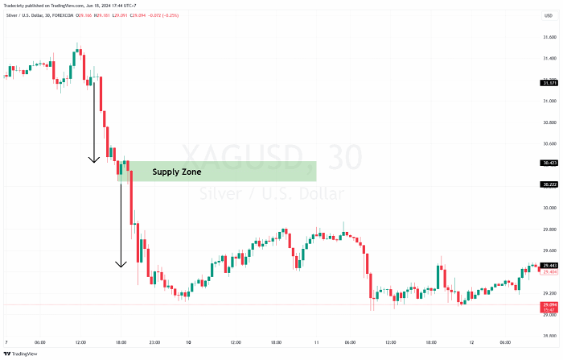
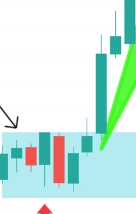
The scenario below shows a supply zone during which the price just spent a handful of candlesticks trading sideways. Such behavior shows a great imbalance between buyers and sellers because the price immediately resumes trending.
When the price returns to the supply zone the next time, the market picks up more selling interest once again and starts trending lower, away from the supply zone.
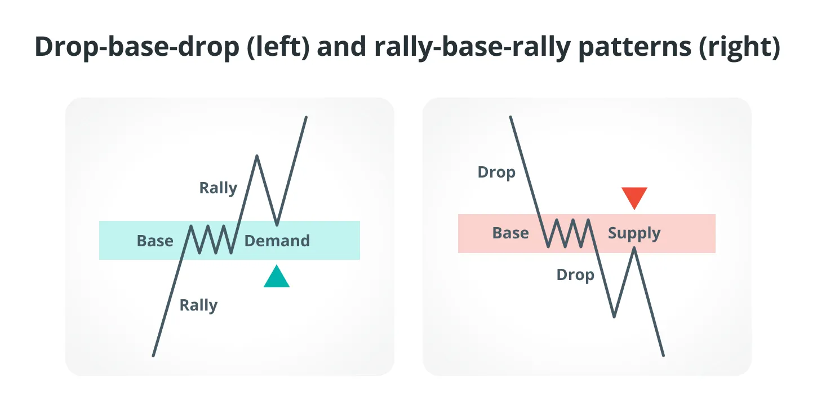
Bonus tip: in trading, the scenario above is called "drop base drop". The supply zone occurs within a strongly trending market phase. The shorter such base phases, the stronger the overall downtrend is.
Reversal patterns
Reversal patterns show prices leaving an upward trend and entering a downward trend, or vice versa.
Drop base rally (bullish)
A price will move downward, then remain around a price for some time, creating a base structure, before rallying upward (high demand).
Rally base drop (bearish)
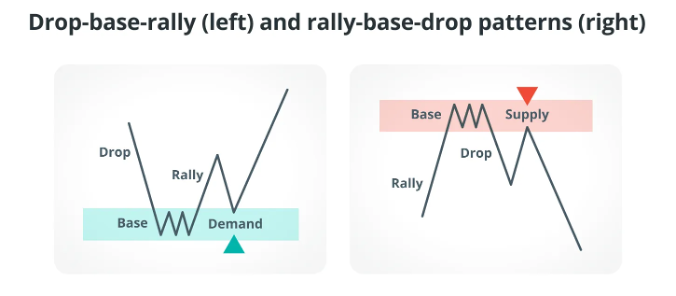
A price will move upward, then create a base, before dropping downward (high supply).
3) THE “SPRING”
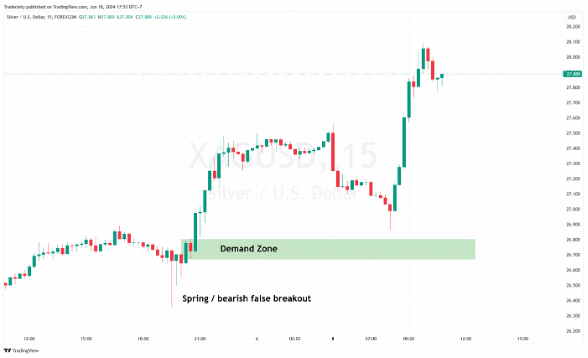
The scenario below shows a demand zone where the price formed a bearish spring pattern shortly before. The spring tempts the average retail trader to go short, selling to the smart money. The following explosive bullish move then leaves the retail traders with losses, forming the demand zone.
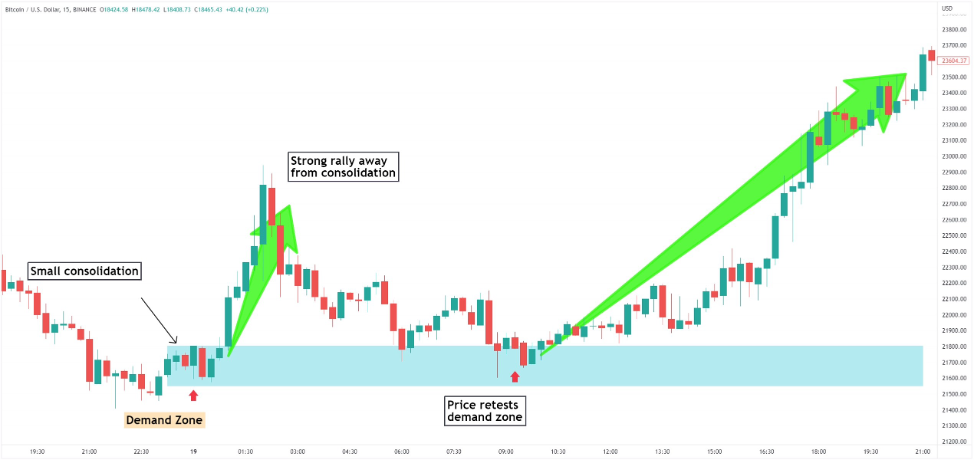
4) STRONG FORCE LEAVING THE ZONE
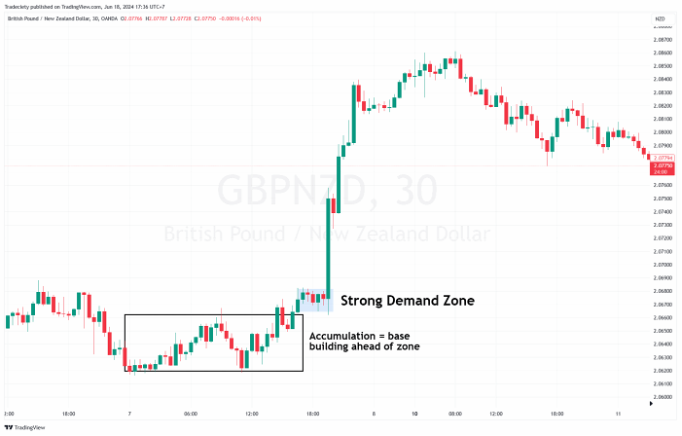
At one point, the price leaves the supply zone and starts trending. A strong imbalance between buyers and sellers leads to strong and explosive price movements. As a rule of thumb, remember that the stronger the breakout, the better the demand zone, and the more open interest will usually still exist – especially when the time spent at the accumulation was relatively short.
The demand zone in the example before was created just before an extremely strong bullish breakout. Finding good supply and demand zones is, therefore, not that difficult when you just start looking for the strongest price movements on your charts. 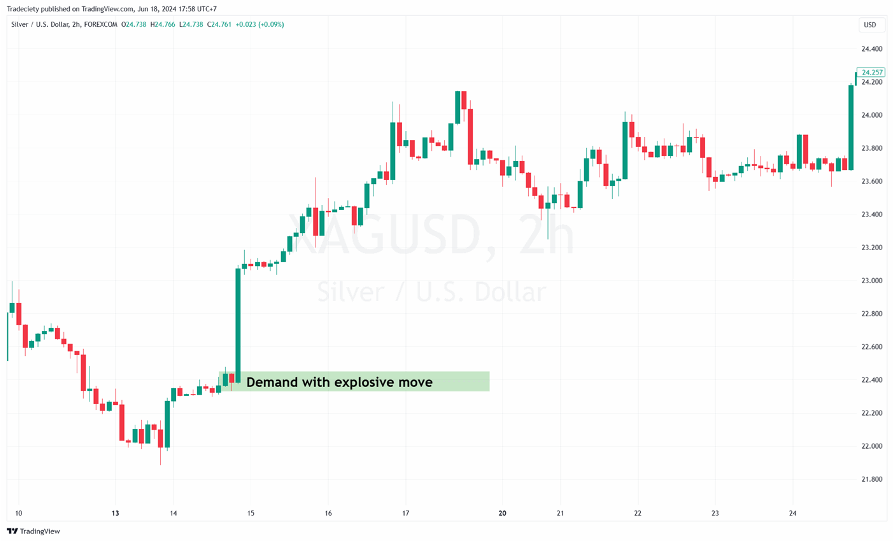
IMBALANCE
In imbalance trading, the areas of interest are identifiable through a specific three-candle pattern. The central candle, or the second in the sequence, represents an impulse move in any direction, flanked by two candles that form the zone's boundaries. This pattern, finalised once the third candle closes, signals an imbalance, suggesting rapid price movement through levels without consolidation.
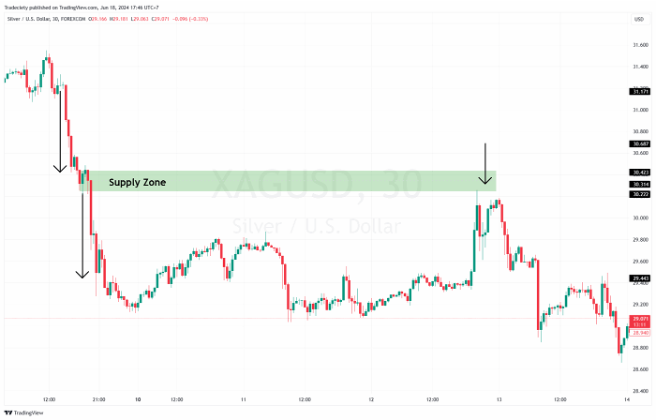
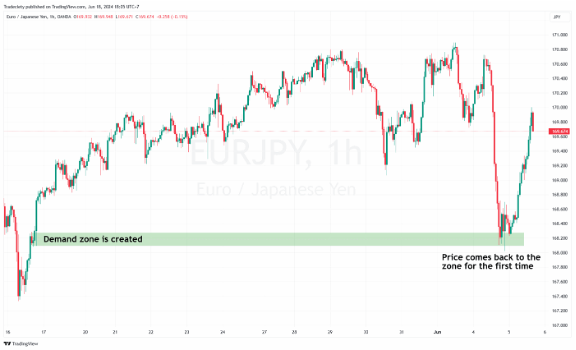
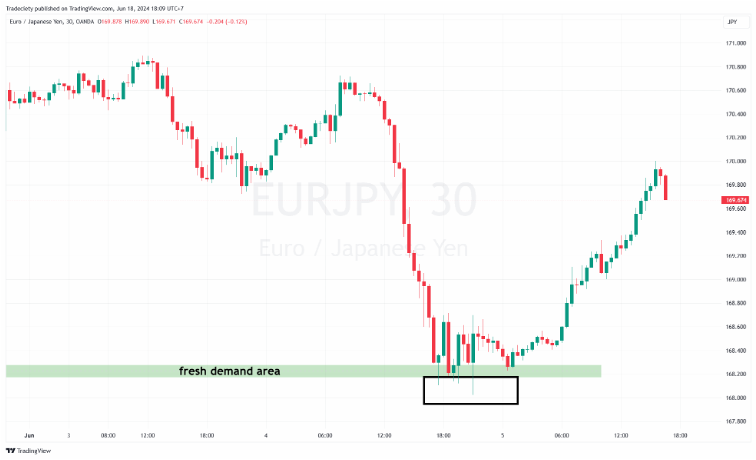
5) FRESHNESS
If you trade supply areas, always make sure the zone is still “fresh” which means that after the initial creation of the zone, the price has not come back to it yet. Each time the price revisits a supply zone, more and more previously unfilled orders are filled and the level is weakened continuously. This is also true for support and resistance trading where levels get weaker with each following bounce.
. 
6) Amateur Squeeze
Inexperienced traders often try to jump into a trade too quickly, so it is important to wait for confirmation before entering a position.
Automated Supply and Demand Trading: Maximizing Efficiency with Bots
We can fully automate this supply and demand strategy once we identify a potential zone, supported by numerous indicators in our favor. With the Tradensea robot, we can set up automatic buy (long) and sell (short) positions with various safety settings. For example, we can configure it to open positions only when a candle within the specified interval is increasing or decreasing, minimizing invalid supply and demand zones.
Additionally, we can set different take profit (TP) levels and integrate our robot with other indicator signals, ensuring that a position is only opened when a specific indicator also confirms the trade at that price level.


